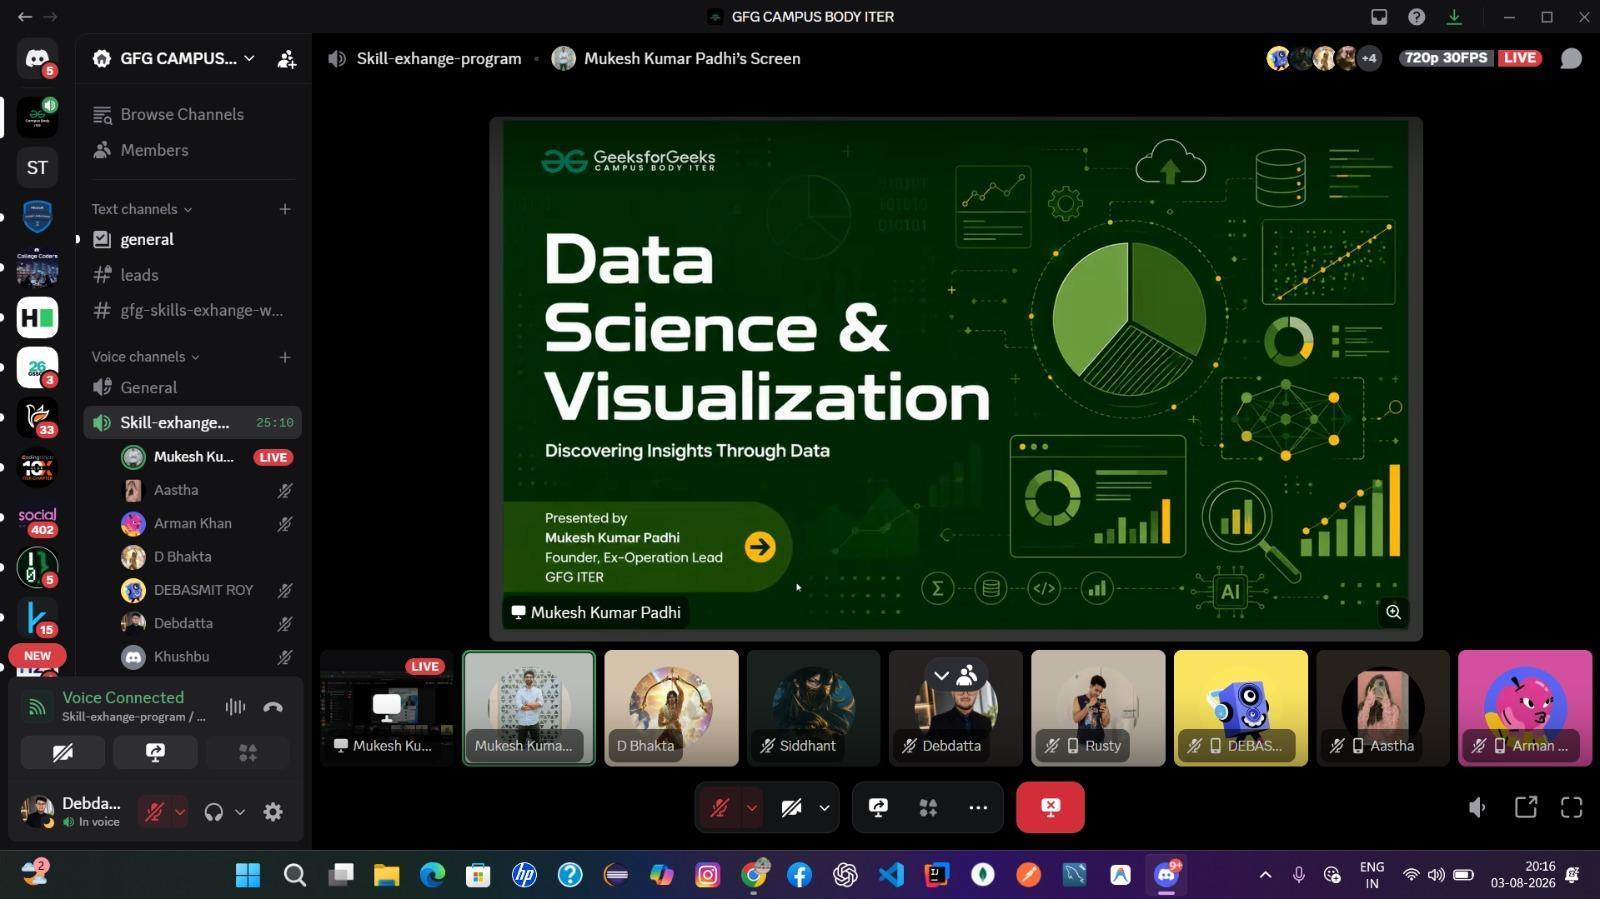
Skills Exchange Workshop – Day 8: Data Science & Visualization
Mission Brief
Day 8 of the Skills Exchange Workshop gave the community a comprehensive tour of data science — from the conceptual relationship between AI, ML, and Deep Learning, through the full data science lifecycle, hands-on Python libraries, and machine learning fundamentals, to concrete project ideas and a career roadmap. Mukesh Kumar Padhi's mix of clear conceptual framing and live code demonstrations made data science both understandable and actionable.
Objectives
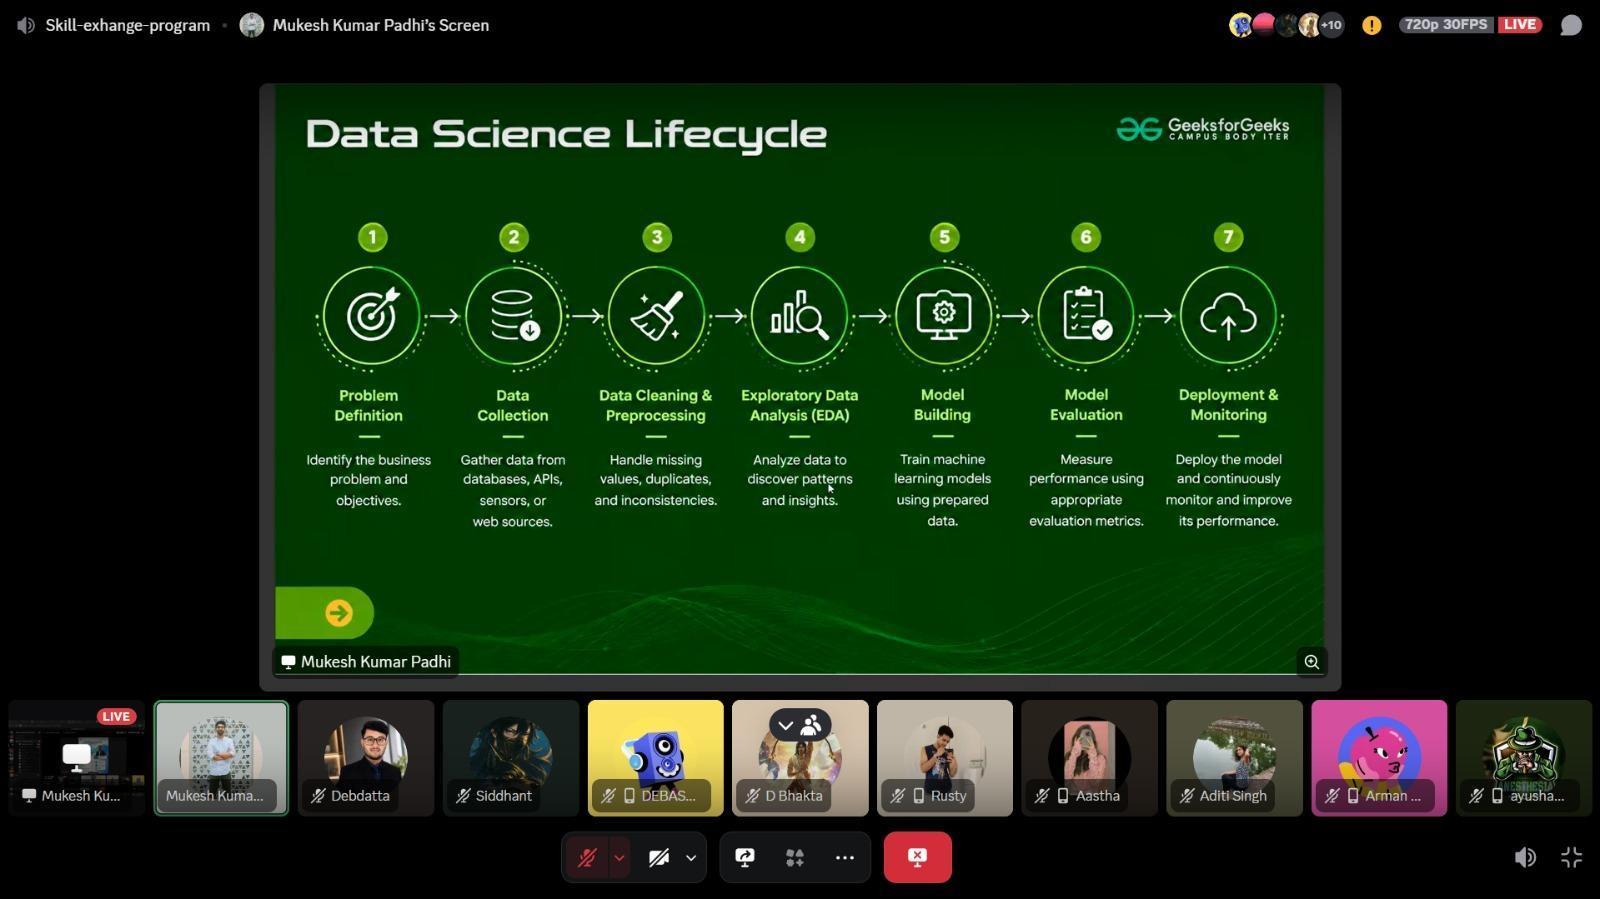
- Master the seven-stage Data Science Lifecycle from problem definition to deployment & monitoring
- Understand the structural differences between structured, semi-structured, and unstructured data
- Gain hands-on experience with NumPy (arrays), Pandas (dataframes), and Matplotlib (visualization)
- Explore the four machine learning paradigms: Supervised, Unsupervised, Semi-Supervised, and Reinforcement Learning
- Review 10 beginner-friendly project workflows and an 8-role industry career roadmap
Crew Dossier
Mission Complete
This event has concluded successfully.
Have questions? Reach us at gfgiter@gmail.com
Event Flow
Everyday examples (Netflix, Amazon, Google Maps) and defining data science
AI vs ML vs Deep Learning vs Data Science and the 7-stage Lifecycle
Hands-on data manipulation with NumPy, Pandas, and Matplotlib plotting
Data cleaning cycles (80% rule) and the Exploratory Data Analysis toolkit
Four learning paradigms, ten mini-projects, and an 8-role career roadmap
Event Gallery